In This Biography
Sources
Air pollution is commonly divided into indoor (household) and outdoor (ambient) pollution.
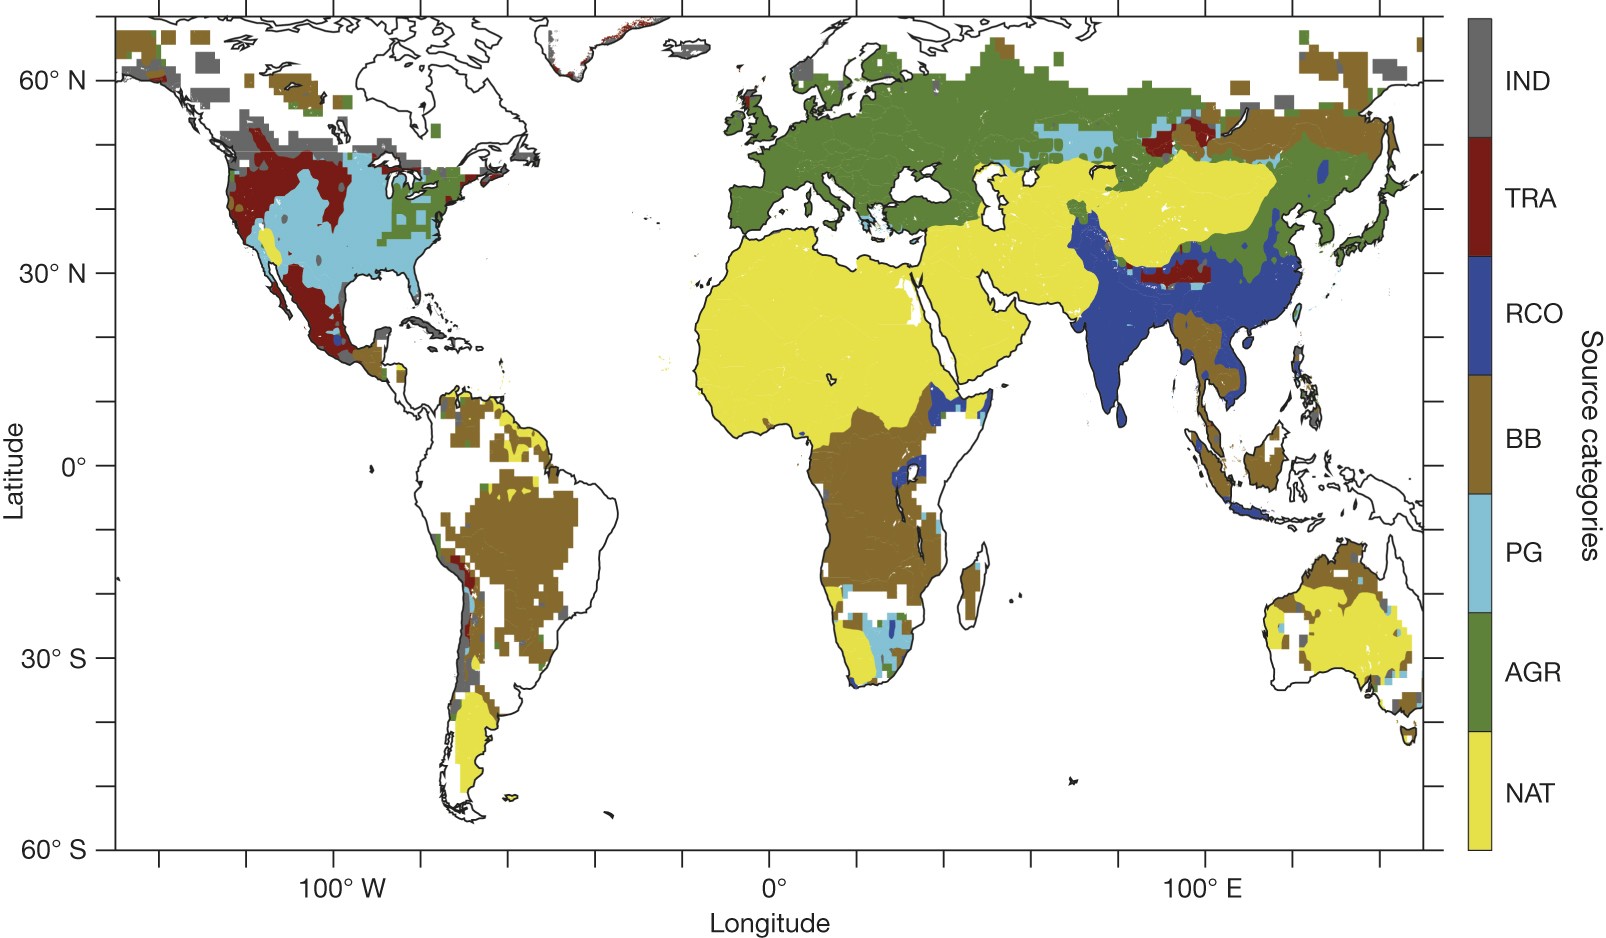
Whilst indoor air pollution is mostly caused by burning solid fuels inside the household, outdoor air pollution originates from a wide variety of sources, including:
- Industry (e.g. Factory-based emissions)
- Transportation (e.g. Diesel vehicles, shipping, etc)
- Residential (e.g. Burning of solid fuels for cooking)
- Biomass burning (e.g. clearing of rainforests)
- Energy/Power generation (e.g. Coal-fired power plants)
- Agriculture (e.g. Ammonia-based fertilizers)
- Natural sources (e.g. desert-originating dust)
The figure below illustrates the largest source of ambient air pollution-related deaths around the world.

Within each country, there are multiple sources of outdoor air pollution. Each of those sources can be tackled by multiple interventions. Those interventions can be carried out by multiple organizations. To untangle this complex landscape, this report will:
- Analyze the impact of air pollution – on health, economic outcomes, and climate change
- Explore the funding situation within air pollution
- Discuss various “impact multipliers” as a framework to evaluate air pollution interventions
Section 1: Size of the problem
Health burden
Mortality
Air pollution is associated with many illnesses, such as respiratory disease (especially chronic obstructive pulmonary disease (COPD)), cardiovascular diseases (especially ischaemic heart disease (IHD)), cancers (especially lung cancer), and stroke.
Exact estimates on all-cause deaths from air pollution vary:
- The IMHE’s 2019 GBD Study estimates annual air pollution deaths to be 6.7 million, which breaks down into 4.5 million from PM2.5 & ground-level ozone, and 2.3 million deaths from indoor pollution.
- The WHO comes to a similar figure of 7 million for 2016 (3.8 million from indoor, 4.2 million from outdoor), combining anthropogenic and natural sources.
- Lelieveld et al. (2019) put total deaths at 8.8 million in 2015. They estimate that 5.5 million deaths originate from anthropogenic sources, of which 3.6 million are from the burning of fossil fuels.
To meaningfully use these estimates for cost-effectiveness analysis, we first need to establish:
- How much a given reduction in air pollution is associated with a fall in mortality (i.e. the exposure-response function), and
- Whether this association between air pollution and mortality is causal
Based on the analysis described in the appendix, we feel comfortable stating that the association between air pollution and mortality is causal, with the exposure-response curve approximated (for our purposes) to a log-linear fit. This implies it is beneficial to reduce PM2.5 at all levels, with only weakly diminishing returns with rising PM2.5.
Neurological impact
Cognition
A 2021 review on the role of PM2.5 exposure in cognitive impairment finds a negative association between air pollution and cognitive ability. In absence of non-observational studies, the reviewers apply the Bradford Hill criteria and conclude that air pollution is causally associated with cognitive decline.
However, a lack of experimental or quasi-experimental studies leaves us unclear about the impact of air pollution on cognition. Additionally, we want to avoid double counting the cognitive costs as both health and economic costs. Therefore, we exclude cognitive costs from the health burden. Instead, we incorporate benefits into the economic impact instead, where there is stronger causal evidence.
Mental Health
Air pollution may also worsen mental health, due to neuroinflammation. We found conflicting evidence about the effect of air pollution on depression. There is less support for a causal relationship here, with a high likelihood of confounding variables. Due to this lack of evidence, and concerns about double counting, we do not include the mental health costs as part of the health burden of air pollution.
Economic impact
Air pollution also has negative flow-through effects on GDP. Worker absenteeism from sickness can mean labor output declines. This absenteeism, along with lower cognitive ability (as mentioned above) can decrease productivity, negatively impacting education and earnings. Air pollution is estimated to cost 3% of the GDP in India, 5% in the United States, and 3.3% of the global GDP.
Estimating a single GDP figure comes with significant methodological challenges. The economic impact described here excludes both (a) healthcare costs of treating diseases caused by air pollution, and (b) economic gains accruing to polluting industries. Whilst numerous studies have been conducted on the microeconomic effects of air pollution, very limited evidence exists at the macroeconomic level. The evidence that is available comes only from Europe or China. Four quasi-experimental estimates suggest the following:
A 10% reduction in PM2.5 in Europe increased GDP by 0.8%, implying that a 1% reduction in PM2.5 increases GDP by 0.08%.
A 10-unit increase in PM2.5 decreases worker output in Chinese manufacturing by 1%, at a sample mean of 101 μg/m3. This implies that a 1% reduction in PM2.5 increases worker output by 0.1%. If we assume that worker output makes up 50% of GDP, then a 1% reduction in PM2.5 increases GDP by 0.05%.
A 1-unit reduction in PM2.5 increased productivity in China by 0.82%. From this, we can extrapolate that a 1% reduction in PM2.5 increases GDP by 0.032%. A different study by the same authors on the same data estimates that a 1% reduction in PM2.5 increases GDP by 0.039%.
A 1% increase in PM2.5 in China decreases GDP per capita growth by 0.058%. (Assuming a fixed population), this implies that a 1% reduction in PM2.5 increases GDP by 0.06%. Averaging these estimates gives an estimate that a 1% decrease in PM2.5 causes an increase in GDP of 0.06%. However, significant caution should be taken before taking this estimate literally. Nevertheless, it seems plausible that the GDP impact is anywhere between 0.01%-0.1%, with many of the best studies we found giving estimates within this range.
For comparison, lead exposure (in total) is estimated to cost 2-4% of GDP in low- and middle-income countries. We can estimate that reducing lead exposure by 1% would therefore increase GDP by 0.02-0.04%. This puts the two problems roughly within the same order of magnitude.
Preacher of Peace Worldwide


LEADERSHIP BY TONY OYATEDOR


Join Mr. Tony Oyatedor Weekly on Adure Radio

DAVE’S SEAFOOD
