Air Pollution, The Research – Part 3
Climate impact
Air pollution and climate change are often discussed in tandem. However, this does not necessarily mean that high pollution indicates high greenhouse gas emissions or vice versa.
CO2- PM2.5 Correlation
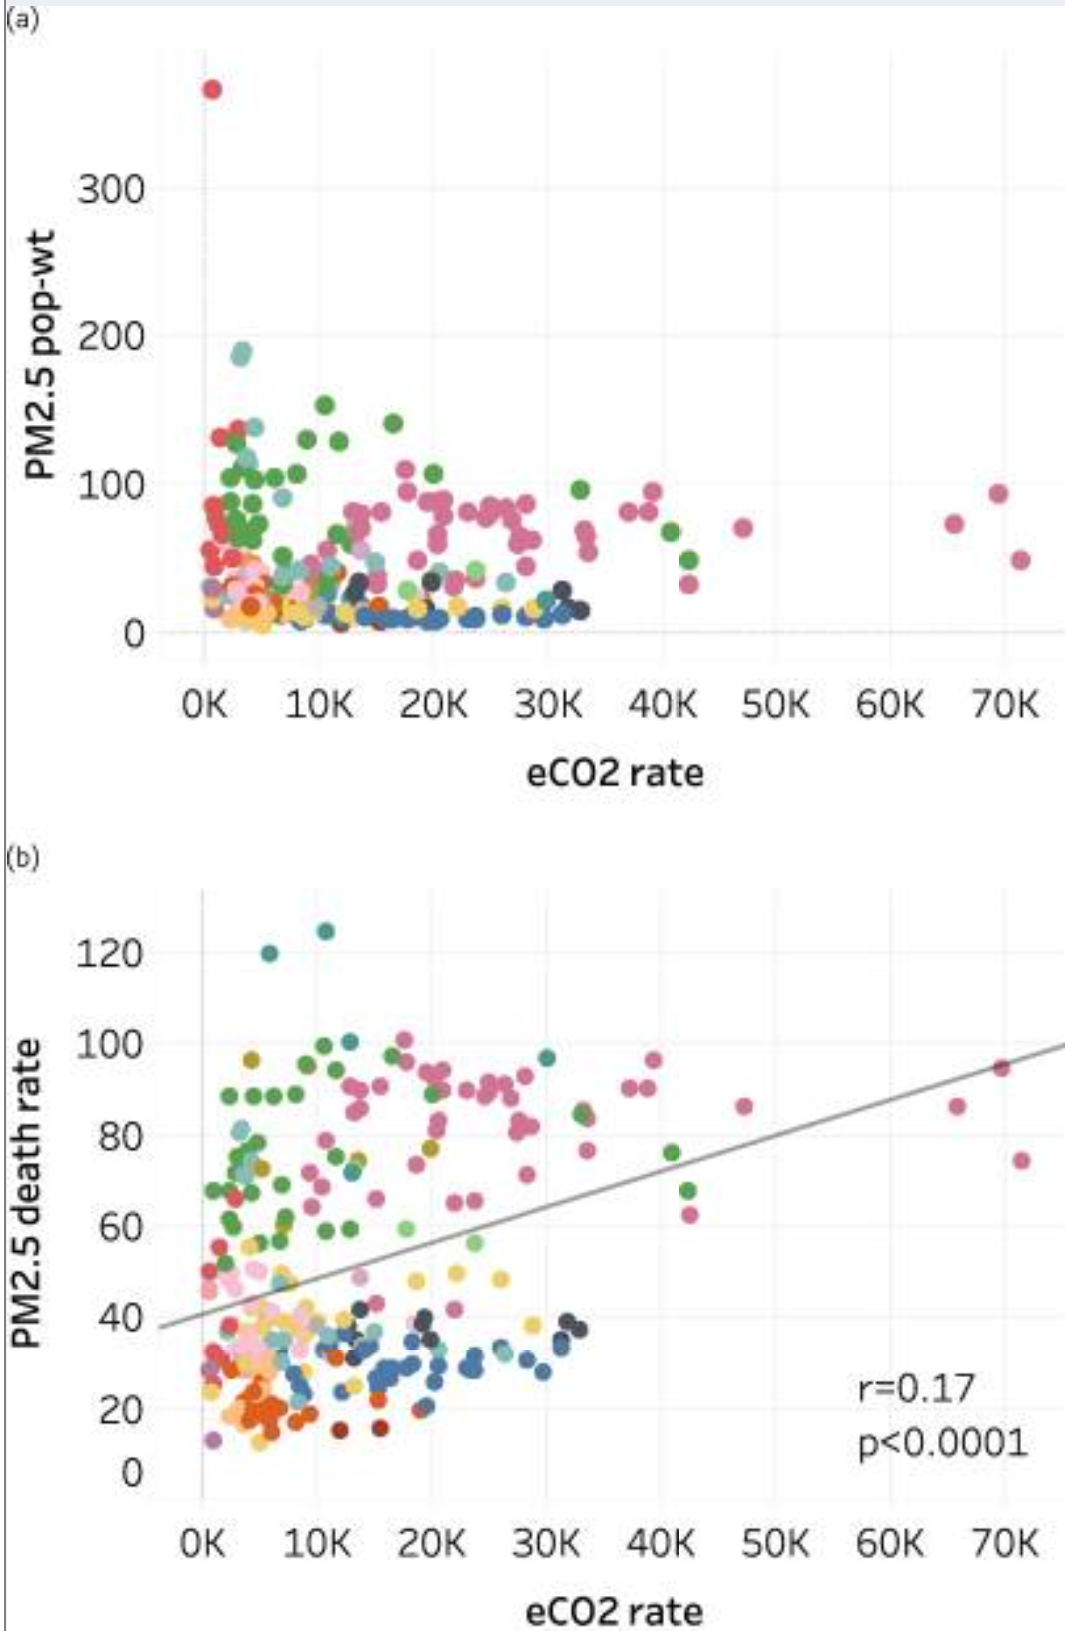
The figure below, from a study analyzing the relationship between PM2.5 and CO2, shows no correlation between PM2.5 concentration and CO2 emissions rate, and only a weak correlation between PM2.5 deaths and CO2 emissions:

City-specific estimates of PM2.5-attributable premature deaths per capita in 2016 versus other city indicators.
(a) Population-weighted annual average PM2.5 concentration (µg/m3) vs. annual CO2 emissions rate (t C per 100,000 people);
(b) PM2.5 death rate (deaths per 100,000 people) vs. annual CO2 emissions rate. Colors indicate world regions. Linear regression lines are shown where correlations are significant, r is the correlation coefficient, and p is the correlation significance level.
The authors suggest that the limited correlation between CO2 and PM2.5 can partially be explained by geographic factors:
Many Asian cities are among the highest for PM2.5 mortality rate, but only 10 Asian cities emit more CO2 per 100,000 people than the largest high-income emitters.
Contrastingly, high-income North American cities have low PM2.5 mortality rates but mid- to-high CO2 emissions rates. European and African cities range from low to very high for PM2.5 mortality rates but African cities are relatively low and European cities in the mid-range for CO2 emissions rates.
They propose that this divergence is due to:
- Governments in high-income countries (HICs) introducing end-of-pipe emissions controls, which address air quality but not carbon
- HICs retiring heavily air-polluting power production (e.g. coal), whilst retaining greenhouse gas emitting power (e.g. gas) with lower PM2.5 output
- HICs offshoring highly-polluting industries from HICs to LMICs, where environmental regulations are weaker.
The key takeaway here is that not all PM2.5-decreasing interventions will also decrease CO2 (or vice versa). Therefore, we cannot assume an equal co-benefit rate between CO2 and PM2.5.
Feedback loops between air pollution and the climate make the impact of reducing PM2.5 additionally challenging to estimate. Counterintuitively, fossil-fuel-related air pollution currently prevents about 0.51 C of additional warming from greenhouse gases. The figure below shows that temperatures would increase with the removal of A) all fossil-fuel-related particulate air pollution, and B) all anthropogenic emissions.

Temperature changes at the surface from removing particulate air pollution. (A) Due to fossil-fuel-related and (B) due to all anthropogenic emissions.This is because particulate matter shields the Earth’s surface from additional warming. Warming particles (for example, black carbon) absorb the sun’s heat, whilst cooling particles (for instance, sulphates) reflect the sun’s heat. Removing all air pollution would also increase evaporation in certain regions due to aerosol particles no longer shielding the ocean.
At the same time, greater precipitation can cause natural PM2.5 to fall, which would bring about benefits for different regions. Some quasi-experimental evidence already indicates that higher precipitation could reduce infant mortality in Sub-Saharan Africa, due to less dust storms PM2.5 from the Sahara Desert. On the other hand, higher global temperatures increase the frequency of wildfires, which in turn increases PM2.5-induced mortality from natural sources.
Thus, reducing air pollution has a complex, ambiguous effect on the climate, whilst climate change has differential effects on mortality from air pollution, depending on the region. Therefore, we analyse air pollution based on its health and economic impact alone, whilst evaluating expected climate damages separately.
Section 2: Air Pollution Funding
Funding within Global Health
In 2021, $63.8 million was spent on tackling air pollution by foundations. Whilst this is an increase compared to previous years, this is far less than other global health issues, such as HIV/AIDs ($650 million) or Covid-19 ($28.7 billion). Air pollution receives just $9.57 per death, or $0.30 per DALY. This compares to $75 per death from HIV/AIDs, meaning that air pollution is 7.8x more neglected relative to the burden of disease. Only 0.5% of official development funding and less than 0.1% of total foundation grantmaking goes directly to tackling air pollution.
Funding within Climate
The $63.8 million spent by foundations on air quality is dramatically dwarfed by the nearly $2 billion spent on climate mitigation, suggesting that air pollution is significantly neglected relative to climate philanthropy.

Regional funding disparities
Within air pollution philanthropy, funding is distorted towards higher income countries today, rather than where the problem is set to be its worst in future. For example, North America receives the largest share of funding from private foundations (as shown below),[56] even though the average PM2.5 concentration in North America is below WHO limits.[57]

China has some of the worst air quality in the world, but there are signs that the situation is improving. South Asia has some of the highest levels of air pollution. Consequently, foundation funding to India has increased.
Outside these areas, the funding situation is much worse: Africa, Latin America, and Asia (excluding China and India) receive only 3.7% of foundation funding – equivalent to only $2.36 million/per year. At the same time, there are an estimated 2.6 million deaths per year from air pollution in this region. This implies less than $1 donated per air pollution death.
For comparison, approximately $14 million was donated to India by air pollution foundations in 2021 – or $8.40 donated for every death.
| Region | Deaths (2019) | Funding (2021) | $s/Death |
| India | 1,667,331 | ~$14,000,000 | $8.40 |
| China | 1,848,274 | ~$6,000,000 | $4.33 |
| Asia (excl. China & India),
Africa and Latin America |
2,614,705 | $2,360,600 | $0.90 |
This implies that Africa, Latin America, and Asia (excluding India & China) are 9.3x more neglected (relative to the burden of disease) than India.
Preacher of Peace Worldwide


LEADERSHIP BY TONY OYATEDOR


Join Mr. Tony Oyatedor Weekly on Adure Radio

DAVE’S SEAFOOD
