Air Pollution, The Research – Part 5
Political tractability by region
Reasoning/intuition: It is better if an intervention has a 50% chance of success rather than a 20% chance. In general terms, we would expect interventions (in particular, policy interventions) to be more effective where civil society has more influence over policy. This is necessary since the main policy lever for funders operates through civil society organizations and through legal challenges
Evidence/Data: An average of proxy indicators for the influence of NGOs over government policy (For example, the democracy index, ease of doing business index, corruption perception index, and rule of law index).
Implication: European and North American countries score highly on this metric. Within LMICs, this pushes away from SSA and MENA, and towards some Southeast Asian countries.
Regional neglectedness
Reasoning/intuition: Under the assumption of diminishing marginal returns, we should expect money to go further in less well-funded places. A $1m increase in air pollution philanthropy would raise foundation funding by only 4.4% in North America but would increase funds by 42% in Africa, Latin America, or Asia (excluding China & India). Thus a shift from North America to these more neglected regions could 10x impact (all else equal).
Evidence/data: Data from Clean Air Fund Funding report.
Implication: Focus funding on the most neglected regions (Sub-Saharan Africa, MENA, Latin America, and SEA).
Source Multipliers
Source affectability
Intuition/reasoning: To provide the greatest benefits, philanthropists should focus on the largest sources of pollution wherever possible. If transport makes up 50% of air pollution and households makeup only 5%, then it is 10x more impactful to eliminate pollution from transport than residential sources, all else equal. By “affectable PM2.5,” I refer to the product of (PM2.5 concentration) * (% of PM2.5 emissions from [source]).
Evidence/Data: We can calculate affectable PM2.5 by multiplying data on:
PM2.5 Concentration * % of PM2.5 concentration from [source].
Source neglectedness
Intuition/Reasoning: Under the assumption of diminishing marginal returns, one should fund the most neglected sources of air pollution (all else equal).
Data/Evidence: It is difficult to find a clear breakdown of air pollution funding by source. However, the Clean Air Fund Report notes that:
Foundations with a climate, environment or energy (CEE) focus provided 88% of total air quality funding in 2021…Only 11% of funding was from foundations with an air quality focus area
This suggests that most air pollution funding is currently targeted at energy and other climate-related sources.
Implication: Because climate-related air pollution sources are already highly crowded, we should not aim to fund both CO2 and PM2.5 reductions – since many of the PM2.5 gains from climate are likely already covered by climate funding. In fact, it would be surprising if the best way to reduce future climate damage were also the best way to reduce air pollution damage today, given the differences between the areas described above. Instead, we should focus on interventions with high PM2.5 reductions, and low CO2 reductions, since these are likely most neglected. For example, regulations on sulphur fuel will have little effect on the climate, but may significantly reduce PM2.5 concentrations.
Approach Multipliers
Policy
Reasoning/intuition: There are likely more benefits to influencing air quality policy than to funding direct interventions (for example, installing air purifiers). This is mainly due to necessity – many of the most effective air pollution interventions require changing or enforcing environmental regulations (rather than more direct, non-policy interventions).
One objection is that policy change work is unlikely to succeed, whereas we can be confident that (e.g. installing air purifiers) will improve air quality with high certainty. However, we assume a position of risk neutrality. As such, policy approaches remain promising if one wishes to maximize the expected impact.
Evidence/data: To estimate the relative value of spending on direct interventions, compared to leveraging government spending, one could consider the ratio of foundation funding ($63.8 million) with government funding ($1.5 billion). However, this alone does not factor in how influenceable government funds are. A more complex model would include this and look at the country- and source-level funding breakdowns.
Implication: Interventions should aim to change policy. This does not mean that we should just focus on policy advocacy – policy change can occur through better air quality monitoring, more research/development, or adaptation.
Policy readiness
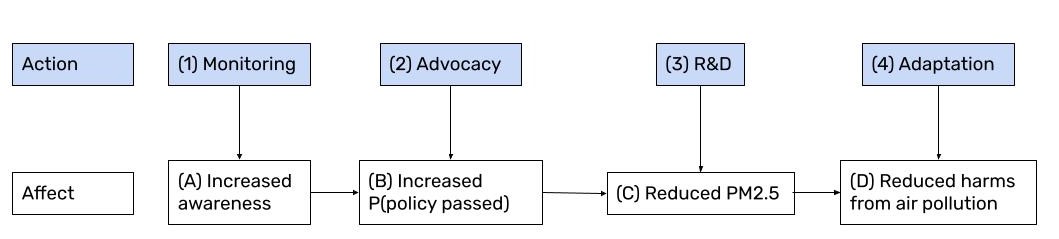
Reasoning/intuition: Consider a basic model of policy change, where we can fund four different interventions, each of which reduces harm from air pollution via action at a particular stage:

Air Quality Monitoring (e.g. low cost sensors), which should (A) raise public awareness, increasing (B) the likelihood of policy change, (C) reduce PM2.5 released, (D) reduce harms from air pollution.
Policy Advocacy, (e.g. lobbying for scrubbers on coal power plants), increasing (B) the likelihood of policy change, (C) reducing PM2.5, (D) reducing air pollution harms.
Research & Development (e.g. clean energy innovation), (C) reducing PM2.5 released, (D) reducing air pollution harm.
Adaptation (e.g. air purifiers), reduces exposure, which (D) reduces harm from air pollution. In this model, we need to decide which stage in the policy process it is most appropriate to act in:
- For example, if no air pollution monitoring is occurring in Country A, then there is high information value to setting up the country’s first air quality sensor network. Thus, we would focus on monitoring in Country A.
- Now suppose Country B has a high-resolution sensor network already set up. In this case, there is less marginal value to monitoring, due to diminishing returns to monitoring.
- Instead, it may be better to pursue another approach (advocacy, R&D or adaptation) in Country B.

This example illustrates that the approach we take to policy change should vary from country to country.
Evidence/Data: There is no cleanly-defined measure of “policy readiness” for each country, and hence this multiplier relies more heavily on subjective judgment. However, we can observe some general trends, such as on monitoring:
“Between 2015 and 2020, spending on data in Africa was approximately $40,000, compared to $4.2 million in Europe and $3.6 million in India”.
Air pollution funding in Africa has only picked up very recently (and remains very low), suggesting that most African countries are less ready for advocacy, with attention instead on data monitoring, research, and raising awareness, rather than advocacy.

Implications: As a general rule of thumb, later-stage theories of change should be pursued in countries with higher economic development. That is:
- For less economically developed countries, where emissions have not yet peaked, it’s better to focus on monitoring how large the problem is – since, in these countries, monitoring networks are often not well established. Sub-Saharan Africa is an example of such a region.
- Policy advocacy is often best in countries where the problem is peaking. In these countries, we are aware of the scale of the problem (due to monitoring), but we need action from governments. South Asia is an example of this.
- In high-income countries with declining air pollution, it is more viable to invest in R&D to achieve further air quality gains (with externalities for lower-income countries). This is likely worthwhile in Europe and the US.
Preacher of Peace Worldwide


LEADERSHIP BY TONY OYATEDOR


Join Mr. Tony Oyatedor Weekly on Adure Radio

DAVE’S SEAFOOD
